good news for all web developers is that now thay can debug javascript with a tool
called Companion.JS
Developed by http://www.debugbar.com Download executable @
http://www.my-debugbar.com/wiki/CompanionJS/HomePage
Companion.JS (pronounced Companion dot JS
or CJS) is a Javascript debugger for IE. The current version is 0.2, adding the
following features to IE :
* Detailled javascript error reporting (call stack and real
file name where the error occured).
* "Firebug"-like
Console API feature.
* Javascript console feature useful to inspect javascript objects at runtime.
* A toolbar icon to open the Companion.JS panel.
Here are some screenshots :
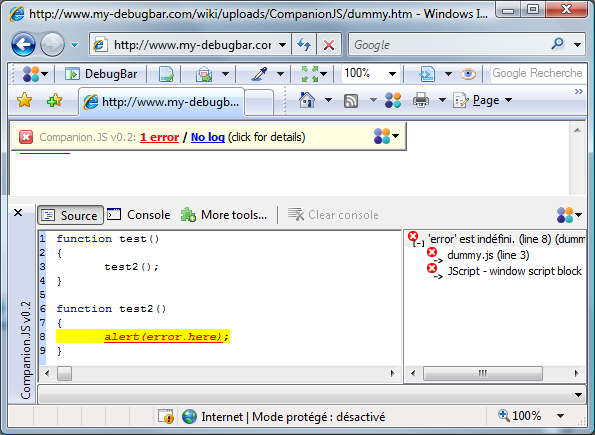
Detailled Error reporting
In the top-left corner the notifying panel which pops-up when an error occurs in
the current page if the Companion.JS panel is not open. At the bottom of the page...
Console API feature
called Companion.JS
Developed by http://www.debugbar.com Download executable @
http://www.my-debugbar.com/wiki/CompanionJS/HomePage
Companion.JS (pronounced Companion dot JS
or CJS) is a Javascript debugger for IE. The current version is 0.2, adding the
following features to IE :
* Detailled javascript error reporting (call stack and real
file name where the error occured).
* "Firebug"-like
Console API feature.
* Javascript console feature useful to inspect javascript objects at runtime.
* A toolbar icon to open the Companion.JS panel.
Here are some screenshots :
Detailled Error reporting
In the top-left corner the notifying panel which pops-up when an error occurs in
the current page if the Companion.JS panel is not open. At the bottom of the page...
Console API feature
